Hands-on Exercise 3: Choropleth Mapping with R

Published

January 25, 2023

Modified

April 3, 2023

1 Getting Started

1.1 Import and Load Packages

pacman::p_load(tmap, tidyverse, sf)

1.2 Import Data

NGA_wp <- read_rds("data/rds/NGA_wp.rds")

2 Basic Choropleth Mapping

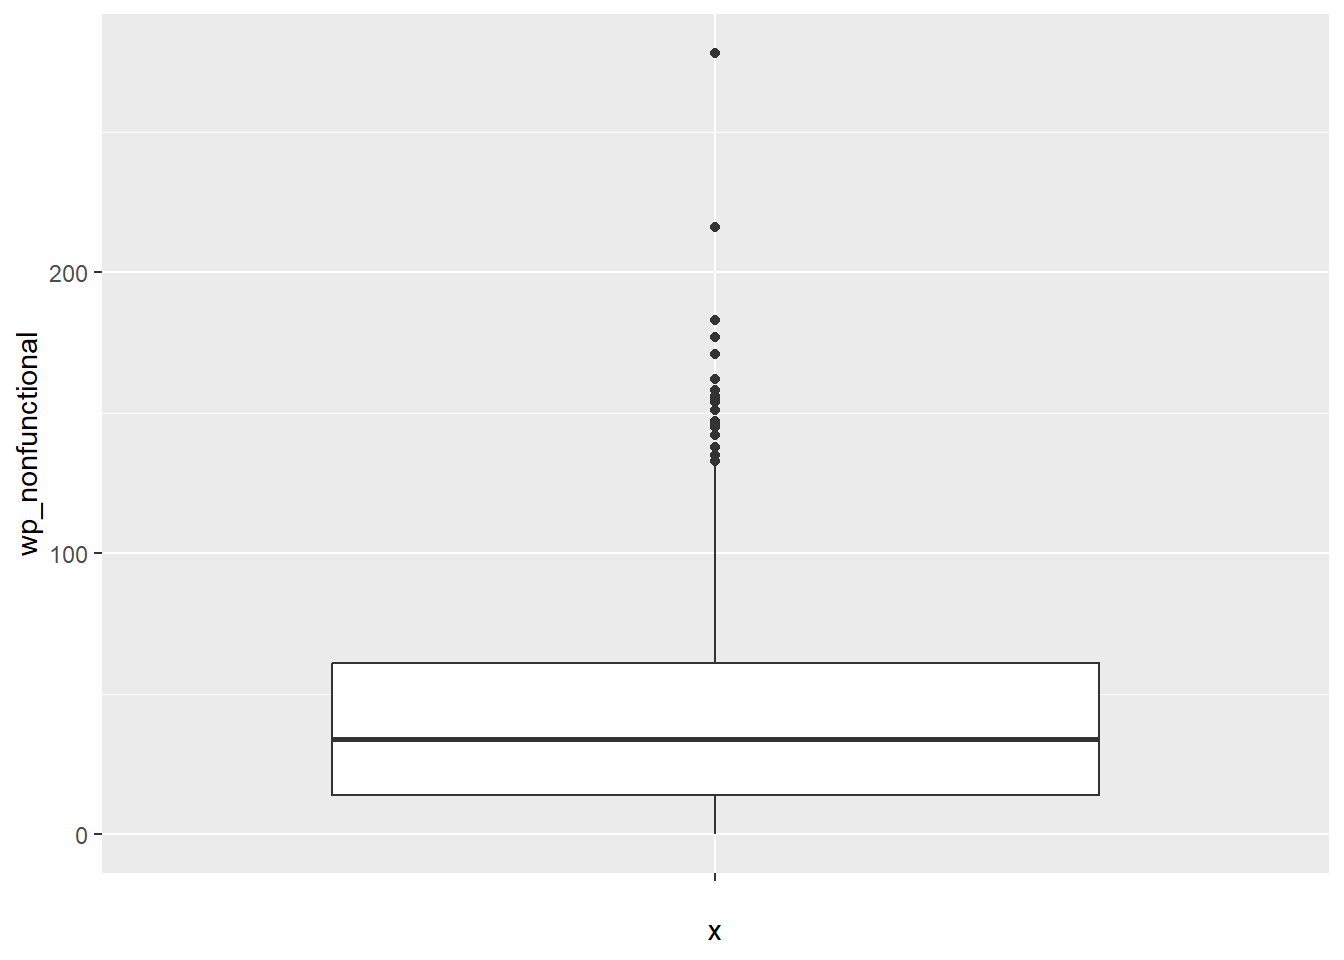
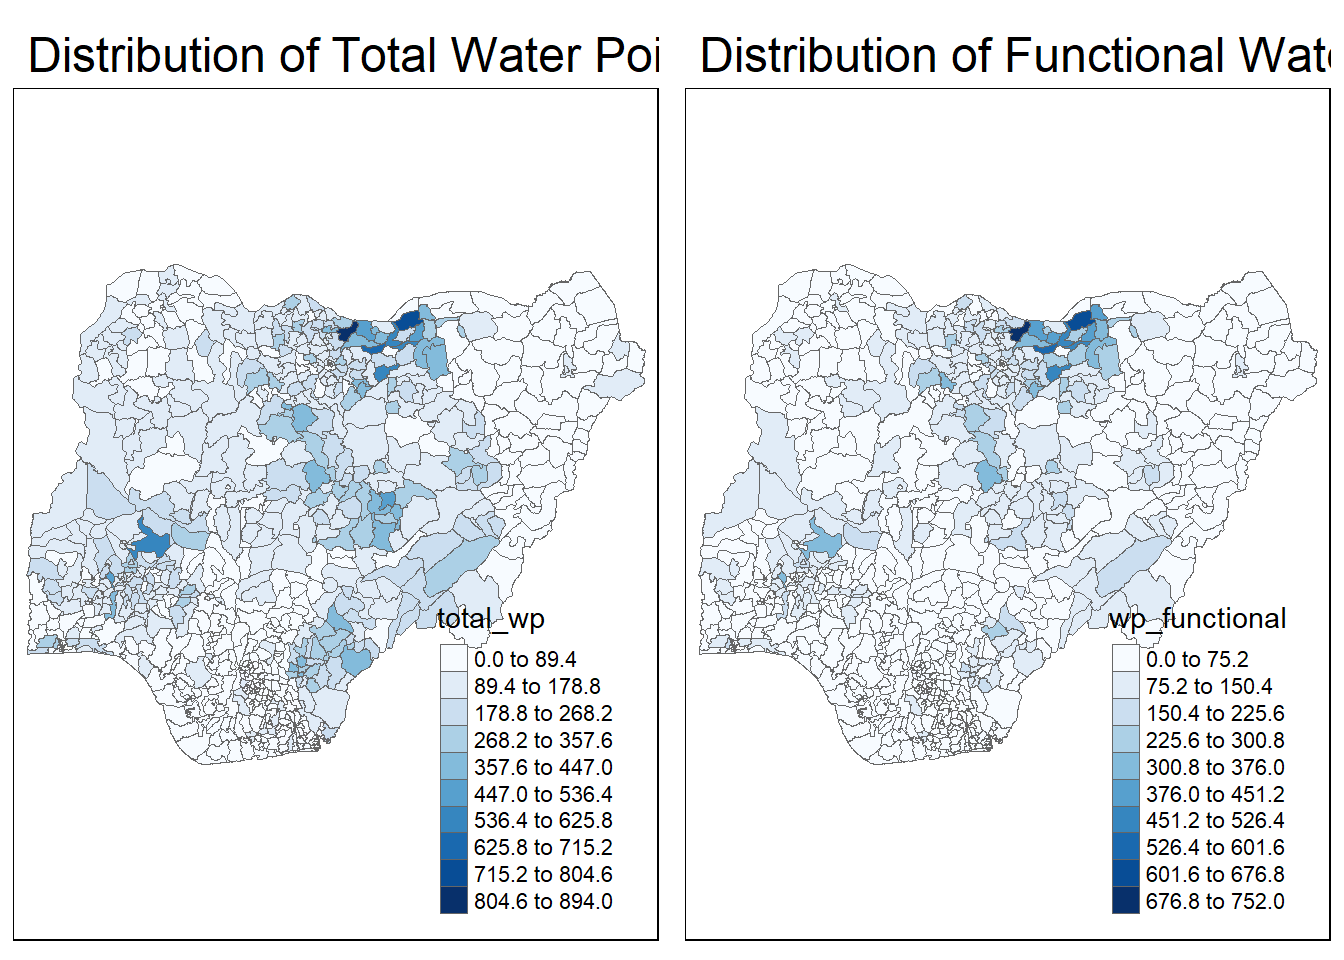
2.1 Visualising distribution of functional water points

p1 <- tm_shape(NGA_wp) +
  tm_fill("wp_functional",
          n = 10,
          style = "equal",
          palette = "Blues") +
  tm_borders(lwd = 0.1,
             alpha = 1) +
  tm_layout(main.title = "Distribution of Functional Water Points",
            legend.outside = FALSE)
p2 <- tm_shape(NGA_wp) +
  tm_fill("total_wp",
          n = 10,
          style = "equal",
          palette = "Blues") +
  tm_borders(lwd = 0.1,
             alpha = 1) +
  tm_layout(main.title = "Distribution of Total Water Points",
            legend.outside = FALSE)

Areas with more water points (functional or non-functional) will have more functional water points regardless.

tmap_arrange(p2, p1, nrow = 1)

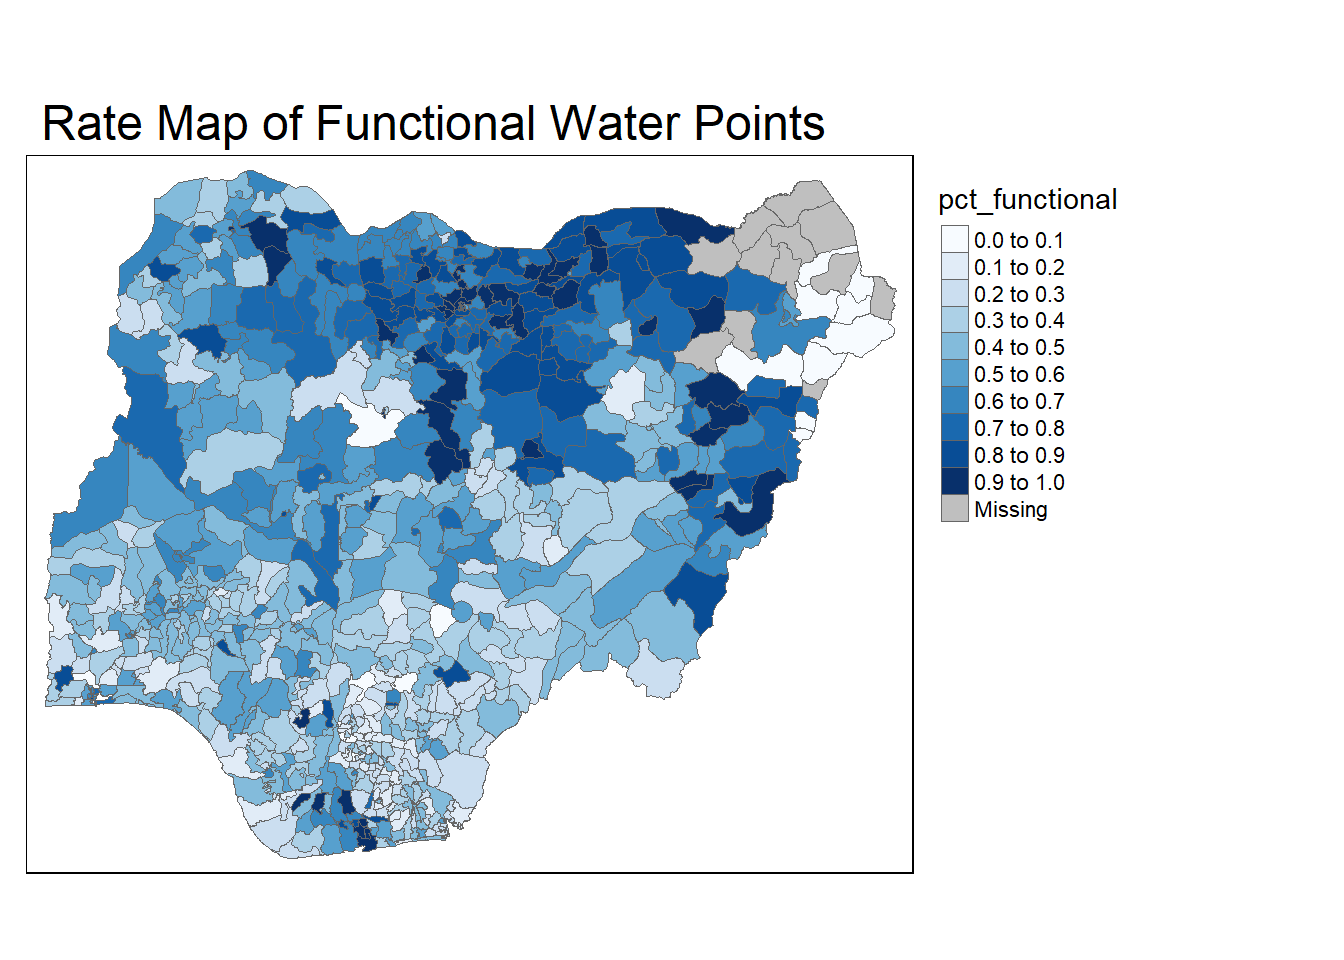
3 Choropleth Map for Rates

3.1 Deriving Proportion of Functional Water Points and Non-functional Water Points

NGA_wp <- NGA_wp %>%
  mutate(pct_functional = wp_functional/total_wp) %>%
  mutate(pct_nonfunctional = wp_nonfunctional/total_wp)

3.2 Plotting Map of Rate

tm_shape(NGA_wp) +
  tm_fill("pct_functional",
          n = 10,
          style = "equal",
          palette = "Blues") +
  tm_borders(lwd = 0.1,
             alpha = 1) +
  tm_layout(main.title = "Rate Map of Functional Water Points",
            legend.outside = TRUE)

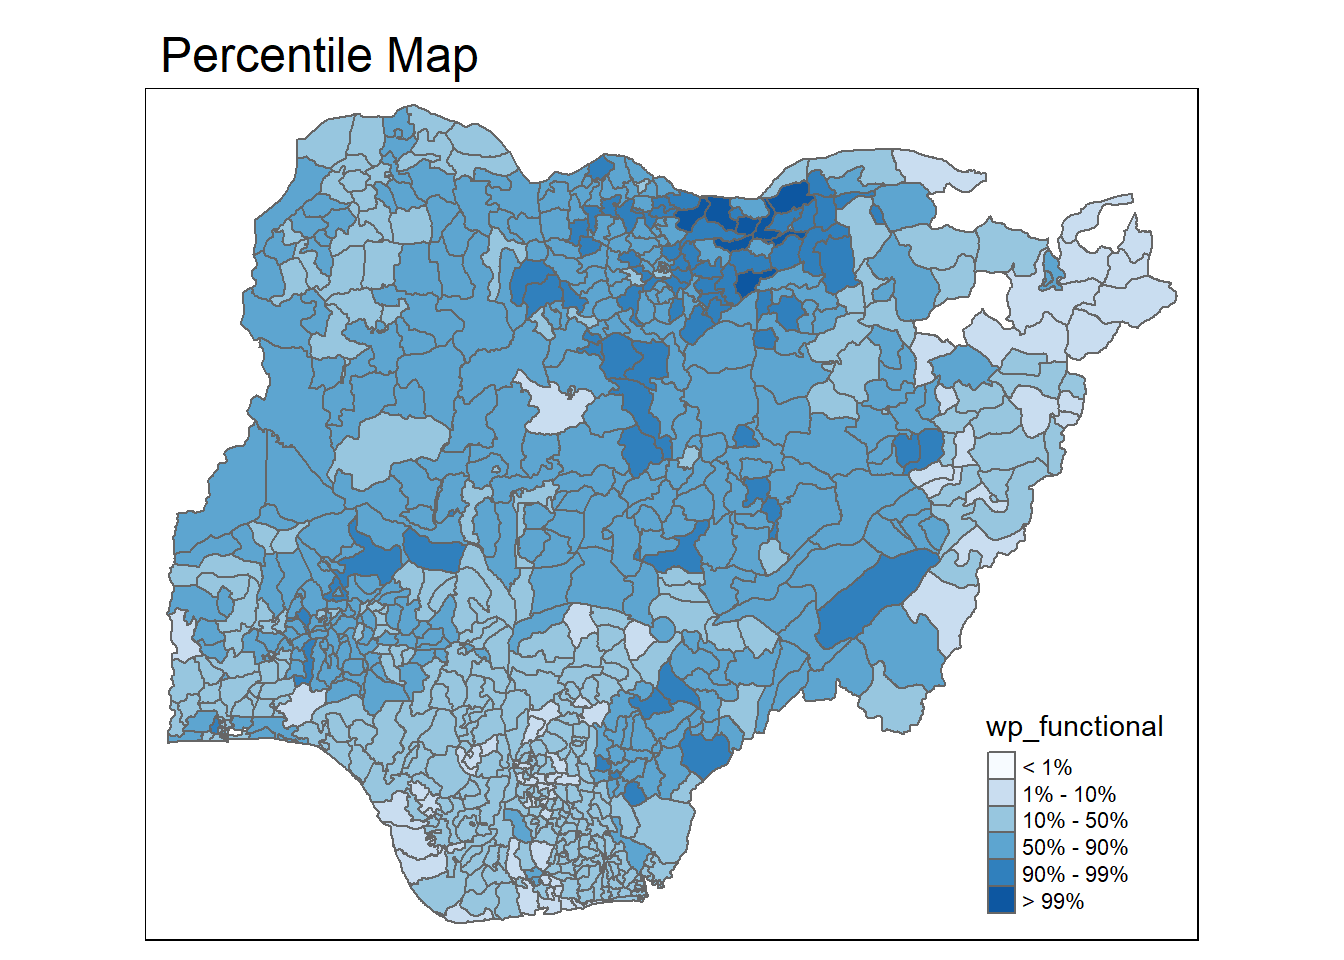
4 Extreme Value Maps

4.1 Percentile Map

4.1.1 Data Preparation

NGA_wp <- NGA_wp %>%
  drop_na()
percent = c(0, 0.01, 0.1, 0.5, 0.9, 0.99, 1)
var <- NGA_wp["pct_functional"] %>%
  st_set_geometry(NULL) # drop geometric field; quantile() doesnt under geometric
quantile(var[,1], percent)
       0%        1%       10%       50%       90%       99%      100% 
0.0000000 0.0000000 0.2169811 0.4791667 0.8611111 1.0000000 1.0000000 
get.var <- function(vname, df) {
  v <- df[vname] %>%
    st_set_geometry(NULL)
  v <- unname(v[,1])
  return(v)
}
percentmap <- function(vname, df, legtitle=NA, mtitle="Percentile Map"){
  percent = c(0, 0.01, 0.1, 0.5, 0.9, 0.99, 1)
  var <- get.var(vname, df)
  bprec <- quantile(var, percent)
  tm_shape(df) +
    tm_polygons() +
    tm_shape(df) +
      tm_fill(vname,
              title = legtitle,
              breaks = bprec,
              palette = "Blues",
            labels = c("< 1%", "1% - 10%", "10% - 50%", "50% - 90%", "90% - 99%", "> 99%")) +
    tm_borders() +
    tm_layout(main.title = mtitle,
              title.position = c("right", "bottom"))
  }
percentmap("wp_functional", NGA_wp)

4.2 Box Map

ggplot(data = NGA_wp,
       aes(x = "",
           y = wp_nonfunctional)) +
  geom_boxplot()